How do I interpret the BCC?
The Body Composition Chart has two axes. The Fat Mass (FM) is on the Y-axis and Fat-Free Mass (FFM) is on the X-axis. Each value is presented as an index, which means - as in the BMI - that the values are normalized by height. This allows a comparison to be made between a man who is 5 ft and a man that is 6.5 ft. Add the FMI and FFMI values together to yield the BMI.
The Body Composition Chart is a two-dimensional (or over time a three-dimensional) BMI that shows what contributes to weight loss - fat mass or muscle mass.
The center of the graphic is the statistical average for the specific patient. In this case, the fat mass is slightly below average for a man because the measurement point moves downwards from the midpoint. The Fat-Free Mass is above-average since the measurement point moves to the right of the midpoint.
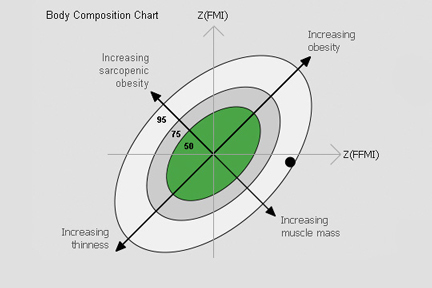
Physically active obese people have both an increased FM and an increased FFM. This type of body composition is reflected in the points in the two upper right quadrants. A low FM with a simultaneous high FFM indicates an athletic body composition and a low FM with low FFM indicates a lean composition. An undesirable body composition is one with an elevated Fat Mass - obesity - along with a reduced Fat-Free Mass - muscle deterioration, referred to as sarcopenic obesity.
The Body Composition Chart is a two-dimensional (or over time a three-dimensional) BMI that shows what contributes to weight loss - fat mass or muscle mass.
The center of the graphic is the statistical average for the specific patient. In this case, the fat mass is slightly below average for a man because the measurement point moves downwards from the midpoint. The Fat-Free Mass is above-average since the measurement point moves to the right of the midpoint.
Physically active obese people have both an increased FM and an increased FFM. This type of body composition is reflected in the points in the two upper right quadrants. A low FM with a simultaneous high FFM indicates an athletic body composition and a low FM with low FFM indicates a lean composition. An undesirable body composition is one with an elevated Fat Mass - obesity - along with a reduced Fat-Free Mass - muscle deterioration, referred to as sarcopenic obesity.